Reconstruction of X-ray µCT data of coral recruits' skeleton
Pipeline for processing and reconstruction of X-ray tomography data of coral recruits’ skeleton, acquired with synchrotron radiation at (BAMline), the imaging beamline at BESSY (HZB - Helmholtz-Zentrum Berlin, Germany). Data preprocessing and reconstruction were performed using the in-house Octave-based reconstruction pipeline in the lab of Dr. Paul Zaslansky at Charité, Universitätsmedizin Berlin.
Tools used for data reconstruction and visualization: TomoTools, NRecon, Dragonfly, Fiji.
Preparing the scans, flat fields and background images
- Open the raw data file with Fiji. Each dataset contains the flat field sets + the scan sets.
- Go to ‘Image > Stack > Tools > Make Substack’, select the range of images containing the flat fields.
- Go to ‘Process > Filter > Mean’ and select ‘2.0’ as mean value (this value can be increased or decreased depending on the dataset).
- Save the filtered flat field sets in separate folders (one set each folder) as FITS image sequences.
- Go back to the initial dataset, go to ‘Image > Stack > Tools > Make Substack’, select the range of images containing the scans.
- Save the scan sets in separate folders (one set each folder) as FITS image sequences.
- Open the dark background files with Fiji. The background images size needs to match the scans size.
- Go to ‘Image > Stack > Z Project’ and select “Average Intensity” as projection type.
- Then go to ‘Process > Filters > Gaussian Blur’
- Finally, save the dark background image as FITS file.
Normalization of radiograms
Radiograms have to be background-corrected by normalization with empty beam (flat-field) images, obtained intermittently, after subtraction of dark-current images.
- Launch TomoTools. Select the directory with the scans (FITS files). Each scan needs to be processed independently.
- Select the directory with the filtered flat fields.
- Select the dark background image.
- Chose a directory for the result data
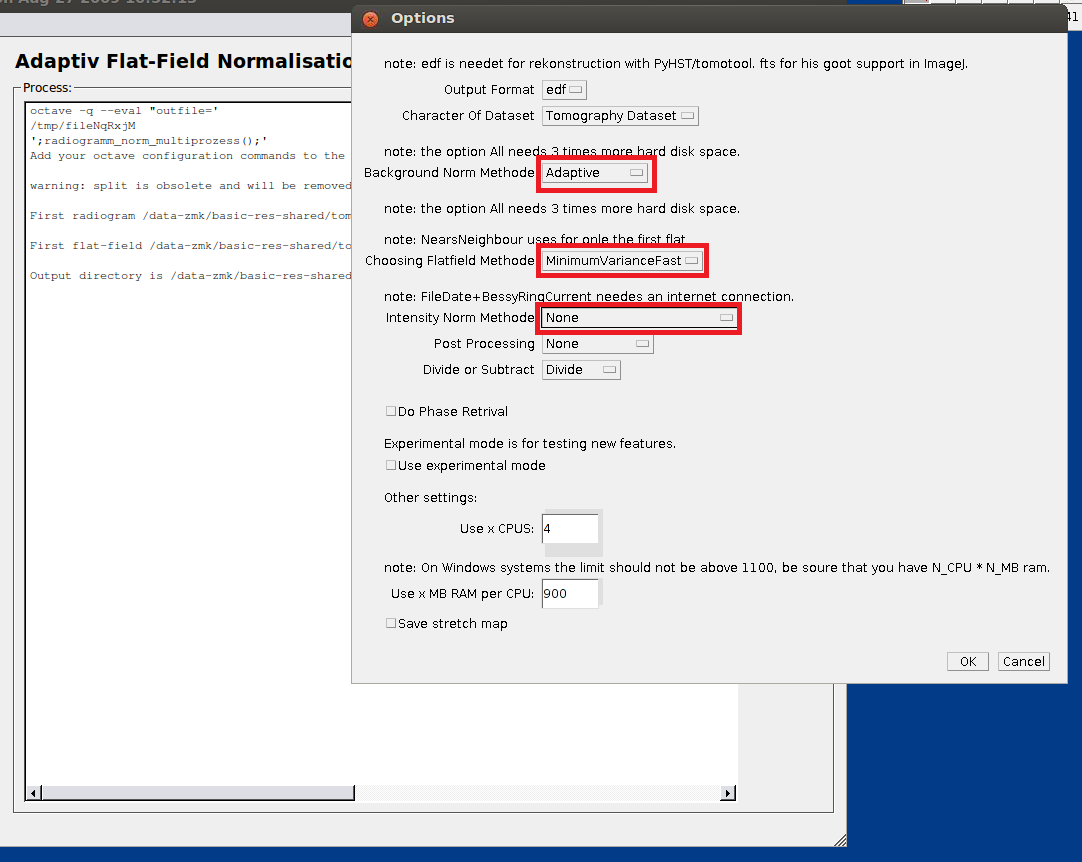
- In the “Option” screen, select “Adaptive” as norm method, “Minimum Variance Fast” as flatfield method and select “None” as intensity norm methode.

- Select a ROI in the upper area of the scan (without the sample), then select a ROI in the lower area of the scan (without the sample), finally select a continuous ROI from upper to lower area (can include the sample).
- Convert the resulting edf fles to 16 bit TIFF files.
Reconstruction of cross-section images
NRecon is used to reconstruct cross-section images from X-ray projections.
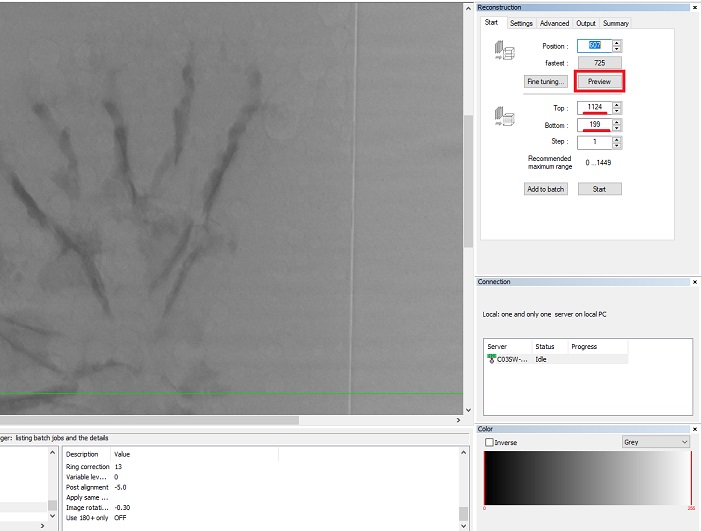
- Load 16 bit TIFF files of the first scan. Select region of interest (where the sample is, the area needs to be of the same size for all scans) in the “Start” menu on the right of the screen and click on “Preview”.

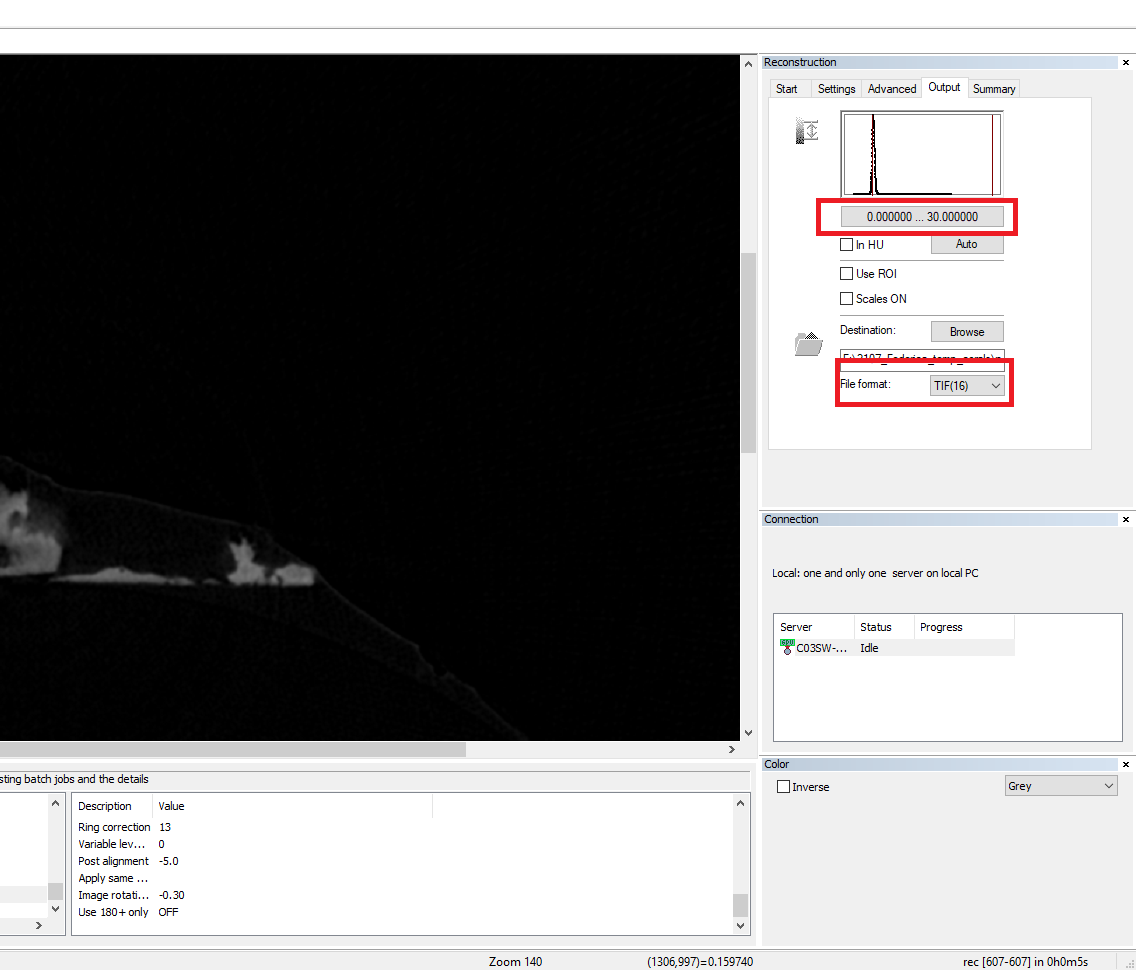
- Go to the “Output” menu and select a range of 0-30 (this range can change depending on the sample). Select the exact same range for all samples to allow for comparisons.

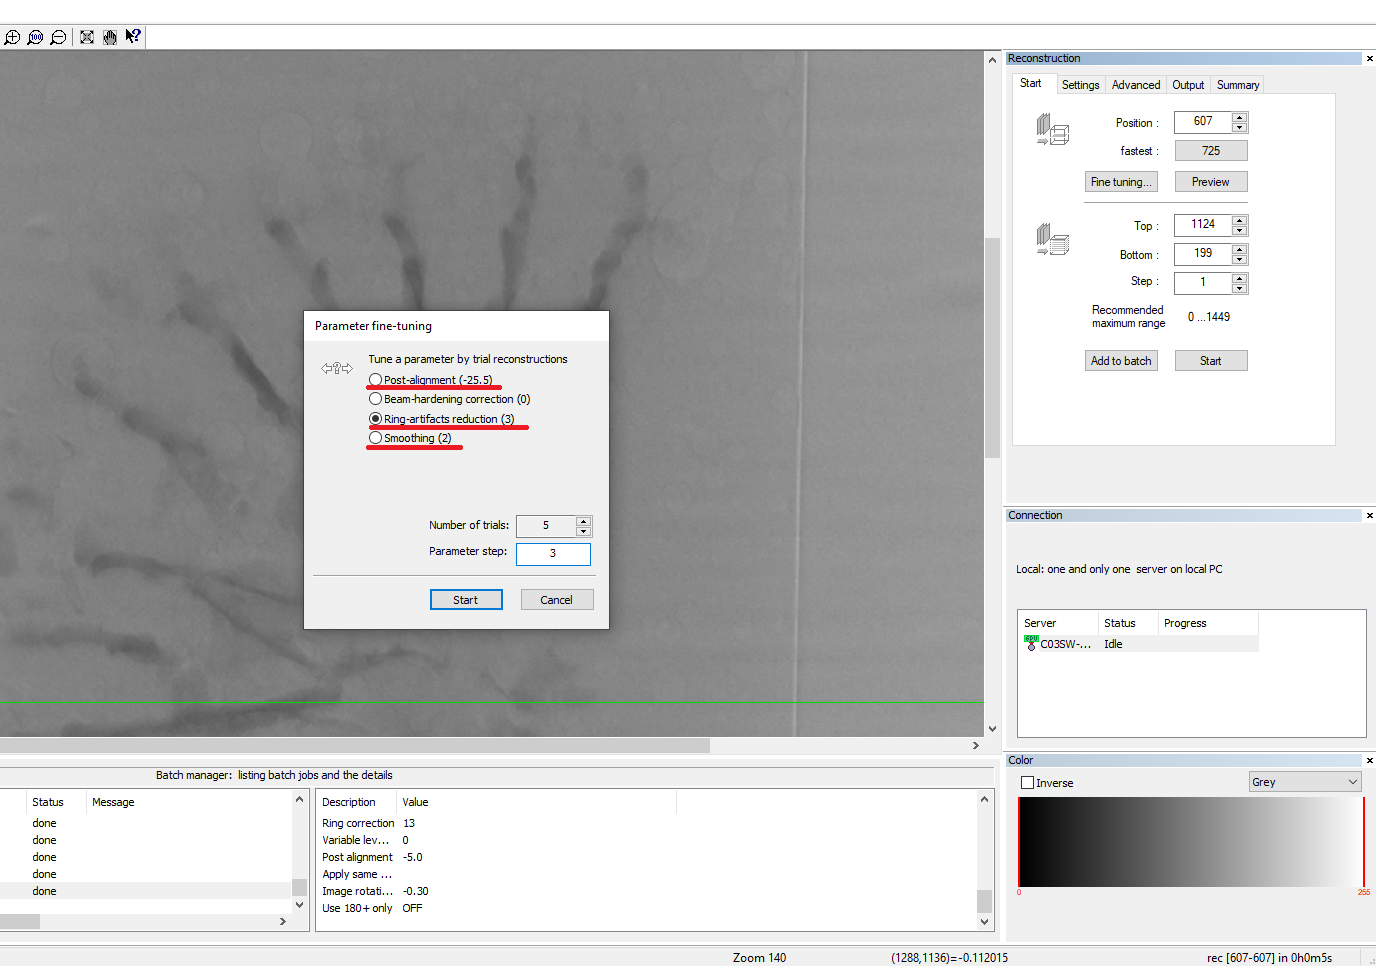
- Go to the “Start” menu and click on “Fine tuning”. In the new window, select “post-alignment” to find the best misalignment compensation value. Set the number of trials to 9.
- Then click again on “Fine tuning” and select “Ring-artifacts reduction” to find the best value for ring artifacts removal. Set the numbers of trials to 5 and the parameter steps to 3.

- Go to the “Settings” menu and select a “Smoothing” value of 2.
- In the “Settings” menu, select the proper rotation degree for the scans (the first scan has zero degree).
- Go to the “Output” menu and select TIFF(16) as file format. Finally, go to the “Start” menu and select “Start”. It is also possible to select “Add to batch” to process multiple scans at the same time.
Merging of scans
- Open the reconstructed TIFF files with Fiji.
- Go to ‘Process > Image calculator’ and merge the scans using ‘Average’ as method.
- Go to ‘Image > Stack > Reslice’ and select start at ‘Top’.
- Go to ‘Image > Transform > Rotate’ and align the scans using the grid lines.
- Go to ‘Image > Stack > Reslice’ and select start at ‘Left’.
- Repeat steps 4 and 5.
- Save stack as ‘Image sequence > PNG files’.
Data 3D visualization
Written on July 19, 2021
