Count coral symbiont cells with Fiji (ImageJ)
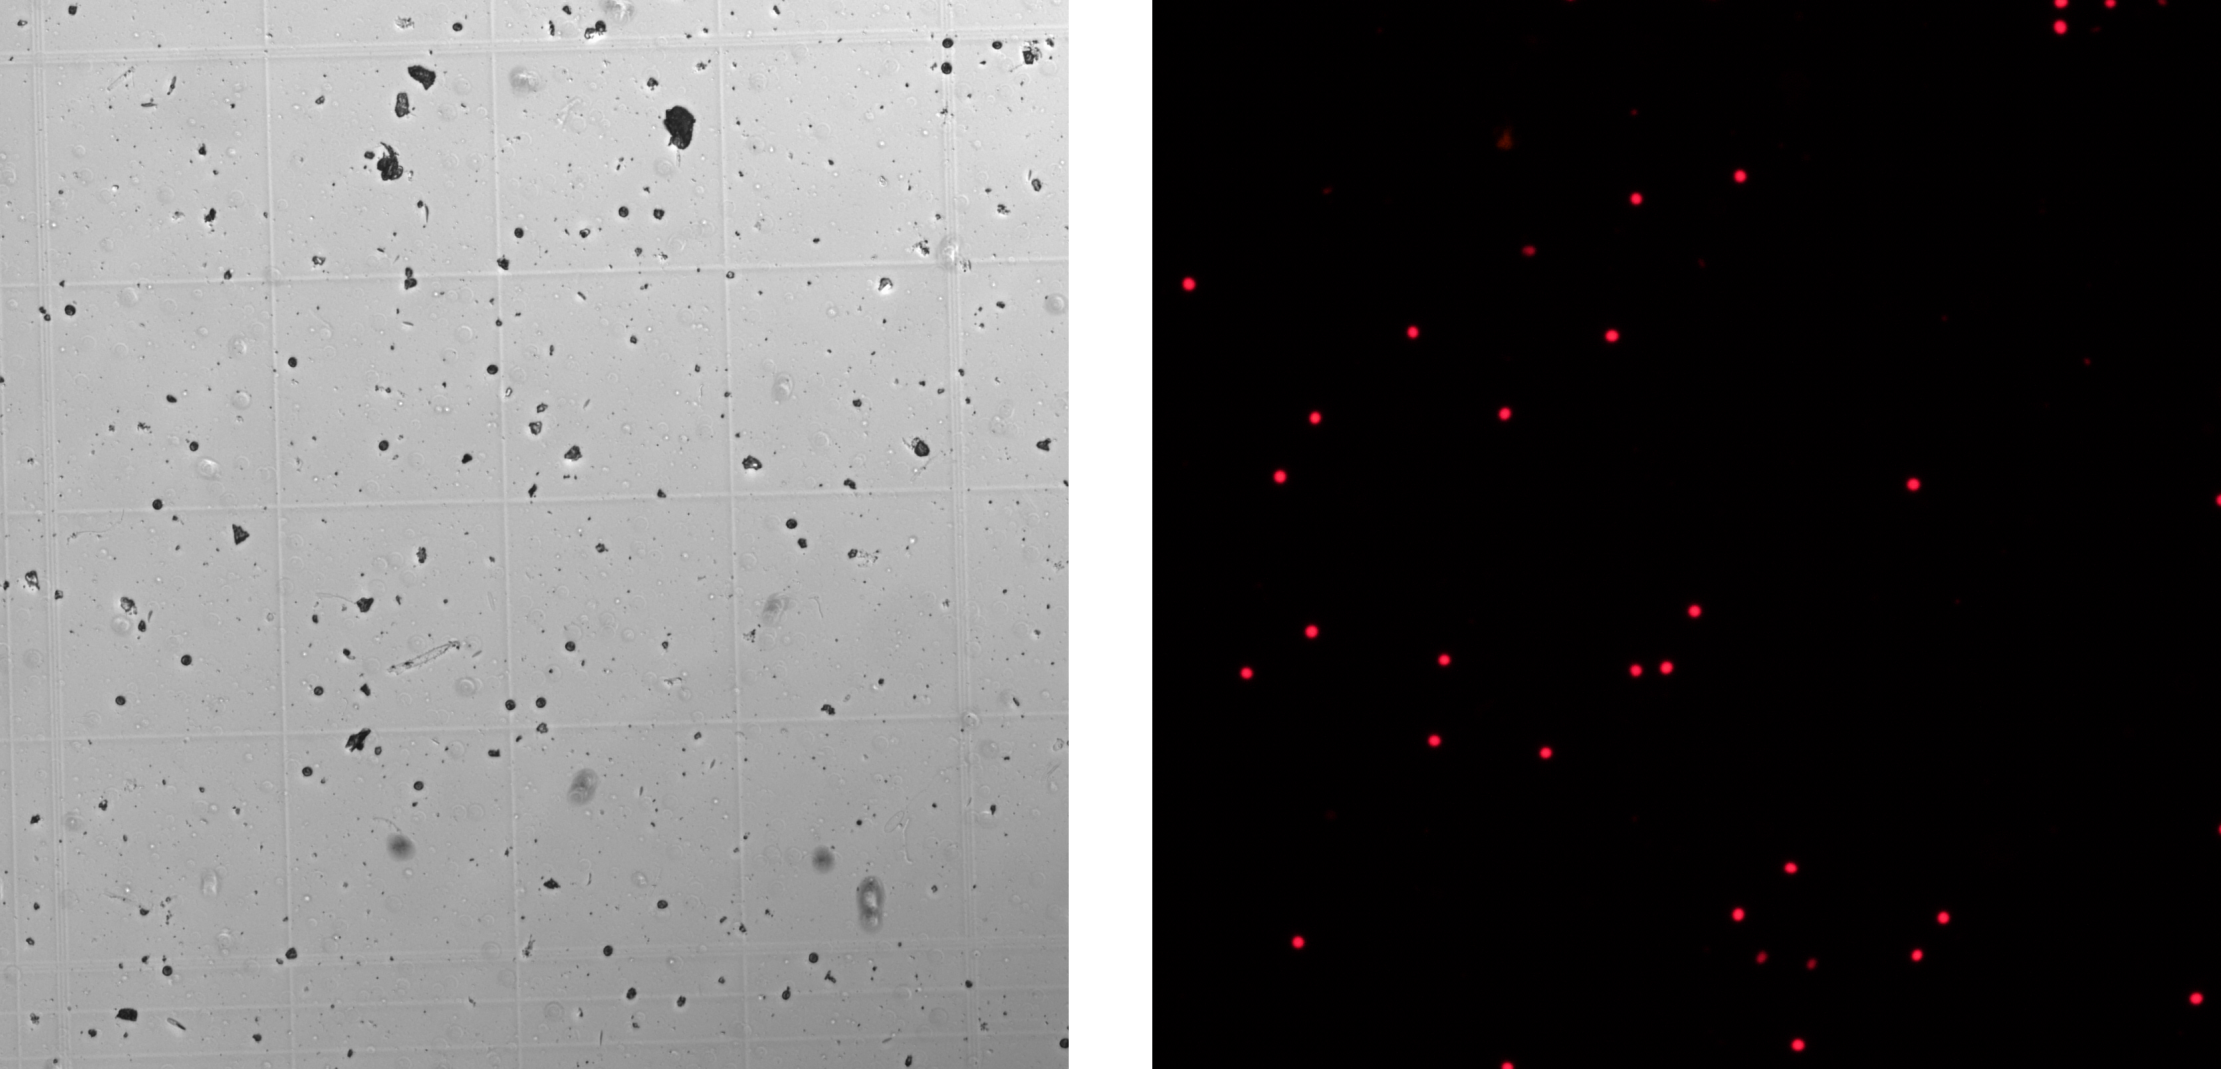
These instructions cover two ways to get algal cell counts using Fiji, one manual and one automated. A fluorescence microscope (Nikon Eclipse Ti, Japan) was used to image symbiotic algae (isolated from coral tissue) both in brightfield and in fluorescent light using 440 nm emission, to identify chlorophyll and to ensure counting of symbiont cells only.
Manual Cell Counting
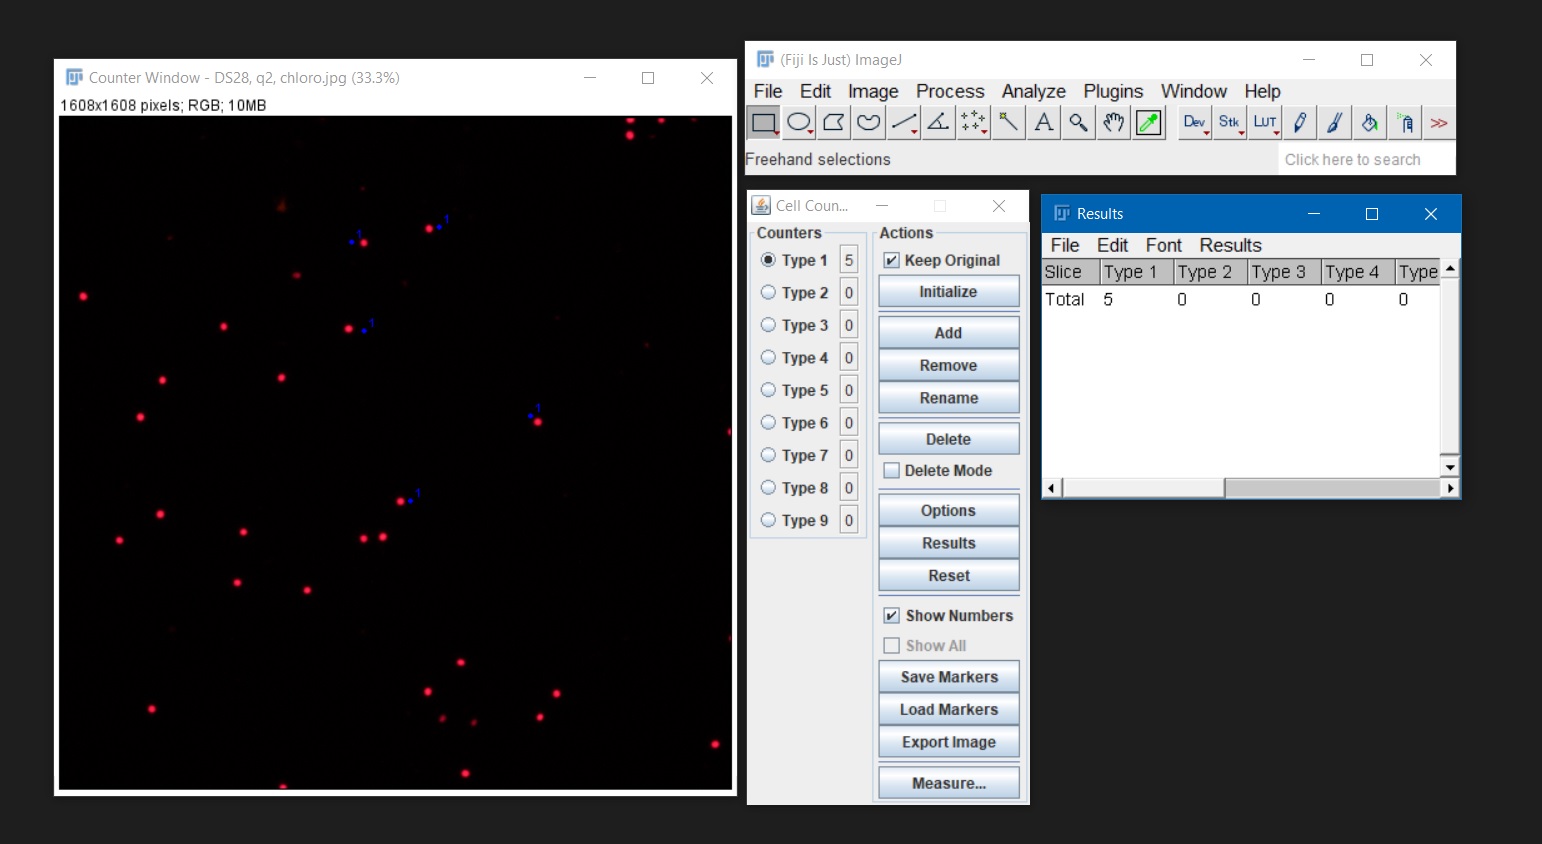
- Open the image you want to count with Fiji and go to
Plugins > Analyze > Cell counter. A new counter window will open. - To begin counting, click one ‘Initialize’ and on ‘Type 1’ in the counter window. Then click directly on a algal cell. A dot and a number will appear on the cell. If you click on an object by mistake, you can undo it by selecting ‘Delete’.
- When you are finished counting, click the ‘Results button’. A new window will appear with the total number of cell counted. Use
Results > File > Save asto save your counts as .csv formatted files. Alternatively, the results log can be copied and pasted on an Excel spreadsheet.
Automated Cell Counting
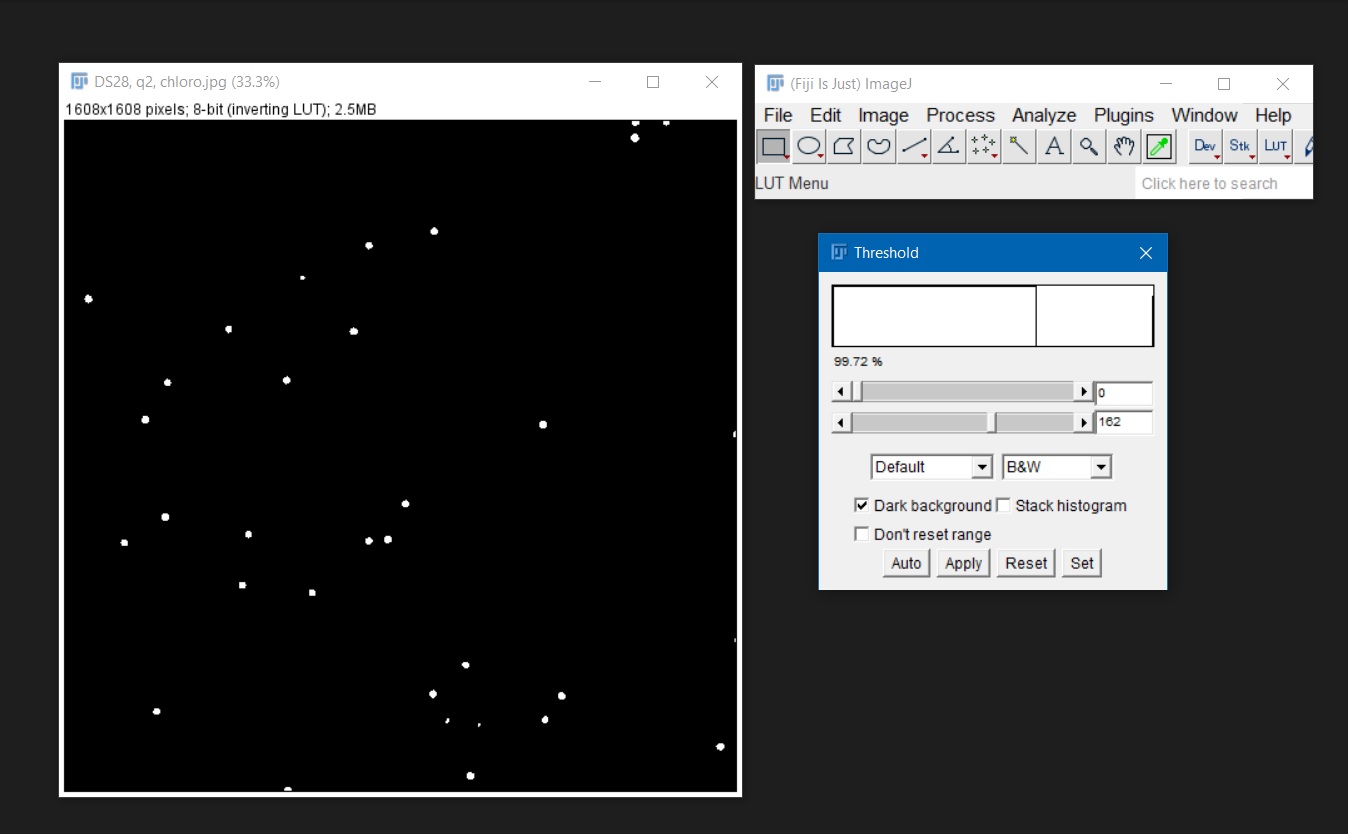
- Open the image you want to count. If it is a color image (RGB), it will have to be converted to greyscale before proceeding. To do so, go to
Image > Type > 8-bitorImage > Type > 16-bit. - Once the image is in greyscale (8-bit or 16-bit) use
Image > Adjust > Threshold. This will highlight the algal cells and will create a binary version of the image with only two pixel intensities: black = 0 and white = 255. If there are partially overlying cells,Process > Binary > Watershedcan be used to cut the cells apart by automatically adding a 1-pixel line.
- Once you have a binary image, go to
Analyze > Analyze Particles. The ‘Size’ option effects what cells (and other particles) will be counted. The size will either be in pixels, or, if the image has been calibrated, in the chosen unit of measurement. To count all cells in the image, leave the ‘Size’ option at the default of ‘0 – Infinity’. To exclude particles based on size (for example to exclude particles that are not algal cells), change the ‘Infinity’ value (you can first measure the area of one algal cell by drawing a circle around it and then usingAnalyze > Measure; then use this measured area to set the maximum size of the count replacing ‘Infinity’). The ‘Circularity’ option excludes cells based on how close to perfectly round they are. To include all cells, leave the default 0.00 – 1.00 (1.00 is a perfect circle and 0.00 is a straight line).
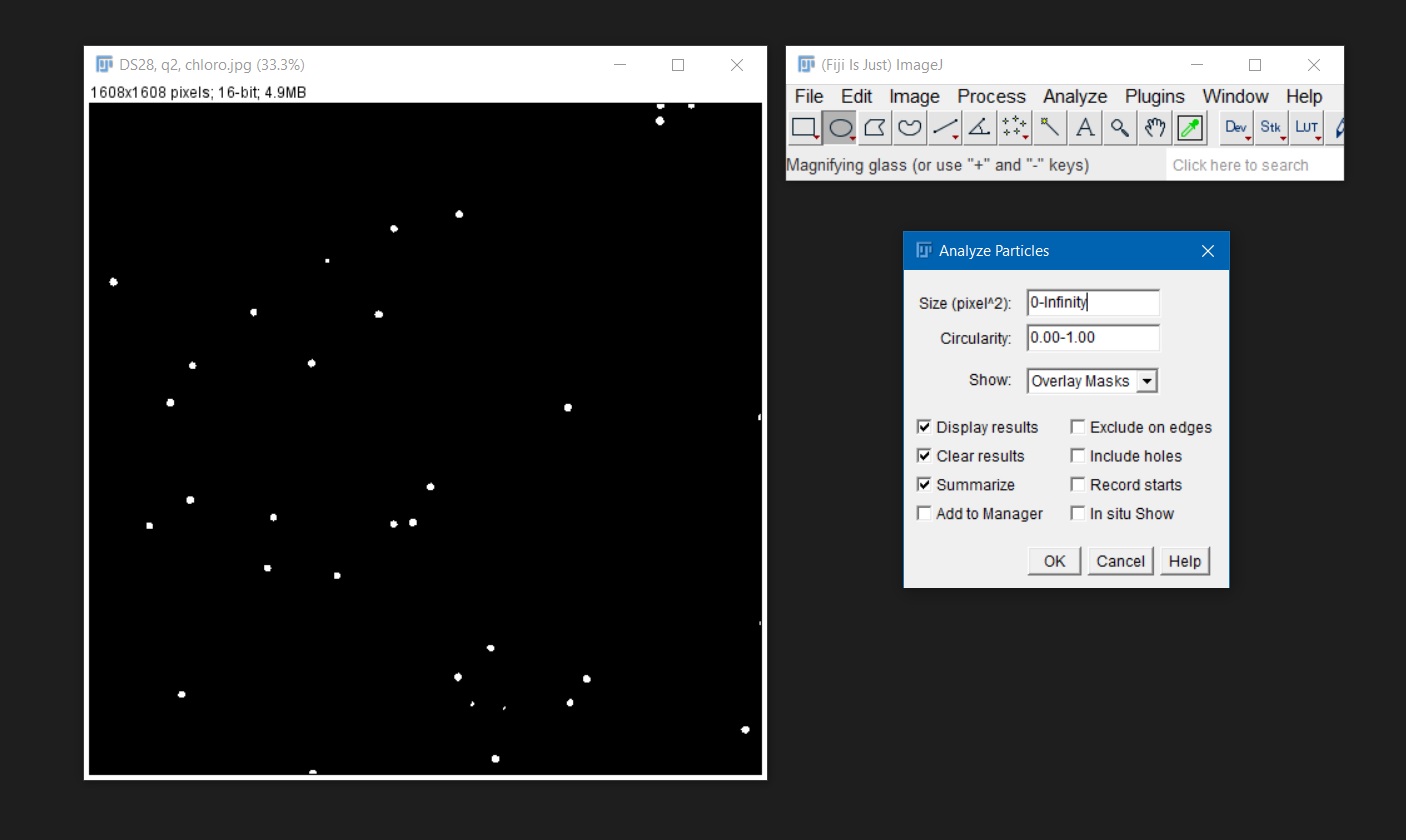
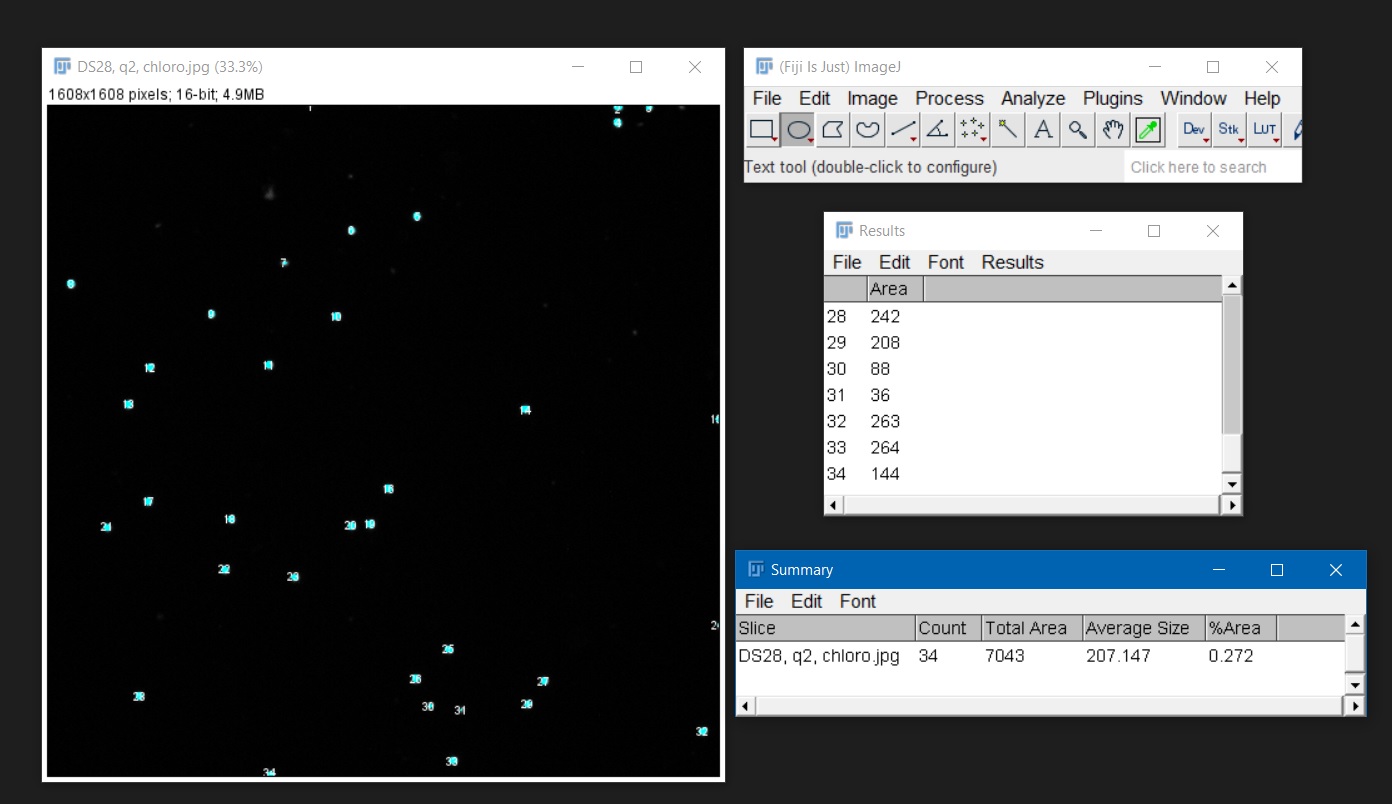
- The example below shows the results of the ‘Overaly Masks’ option. A copy of the image appears, and all counted cells are shown with numbers and with a different color (in this case light blue). These numbers, together with the area of the counted cells, will be displayed in the ‘Results’ window. The ‘Summary’ window shows a summary with the name of the image, the total number of counted cells and other information. You can save your counts as .csv formatted files. Alternatively, the results log can be copied and pasted on an Excel spreadsheet.
Written on December 6, 2020
